Plot gaze fixation data overlayed on a bitmap image. This is a convenience wrapper around ggplot2::ggplot().
fixPlot(
  data,
  bgImage = NULL,
  bgAlpha = 0.33,
  xyMap = ggplot2::aes_string(x = "xpos", y = "ypos"),
  pointMap = ggplot2::aes_string(size = "dur"),
  pointAlpha = 0.5,
  mar = c(0, 0, 0, 0),
  ...,
  showPlot = TRUE
)
Arguments
- data
A data.frame containing one fixation per row. Must include at least x and y coordinates. Origin is assumed to be upper left corner.
- bgImage
Path to background image. Must be a PNG file. Usually this will correspond to the visual stimulus being viewed by subjects while their eye movements were recorded.
- bgAlpha
Alpha level for background layer. Defaults to .33.
- xyMap
Aesthetic mapping (ggplot2::aes_string()) for x and y coordinates. Passed to ggplot().
- pointMap
Additional aesthetics specific to points. Passed to geom_point().
- pointAlpha
Set fixation point transparency. Defaults to .5.
- mar
A 4 vector for margin adjustment (x & y scale limits): top, right, bottom, left. Use positive values move margins toward center of plot (trim the display area). Use negative values to expand the display area beyond the bitmap.
- ...
Additional arguments passed to ggplot2::geom_point().
- showPlot
Logical indicating whether to display the plot. Defaults to TRUE.
Value
A ggplot2 object.
Details
This is a convenience function for using ggplot() to lay fixation data over a background bitmap. At present, only PNG files are supported for background images. Usually, these will correspond to the visual stimulus viewed by subjects while gaze was recorded. Function returns a ggplot2 object which can be further modified by ggplot2 geoms.
Examples
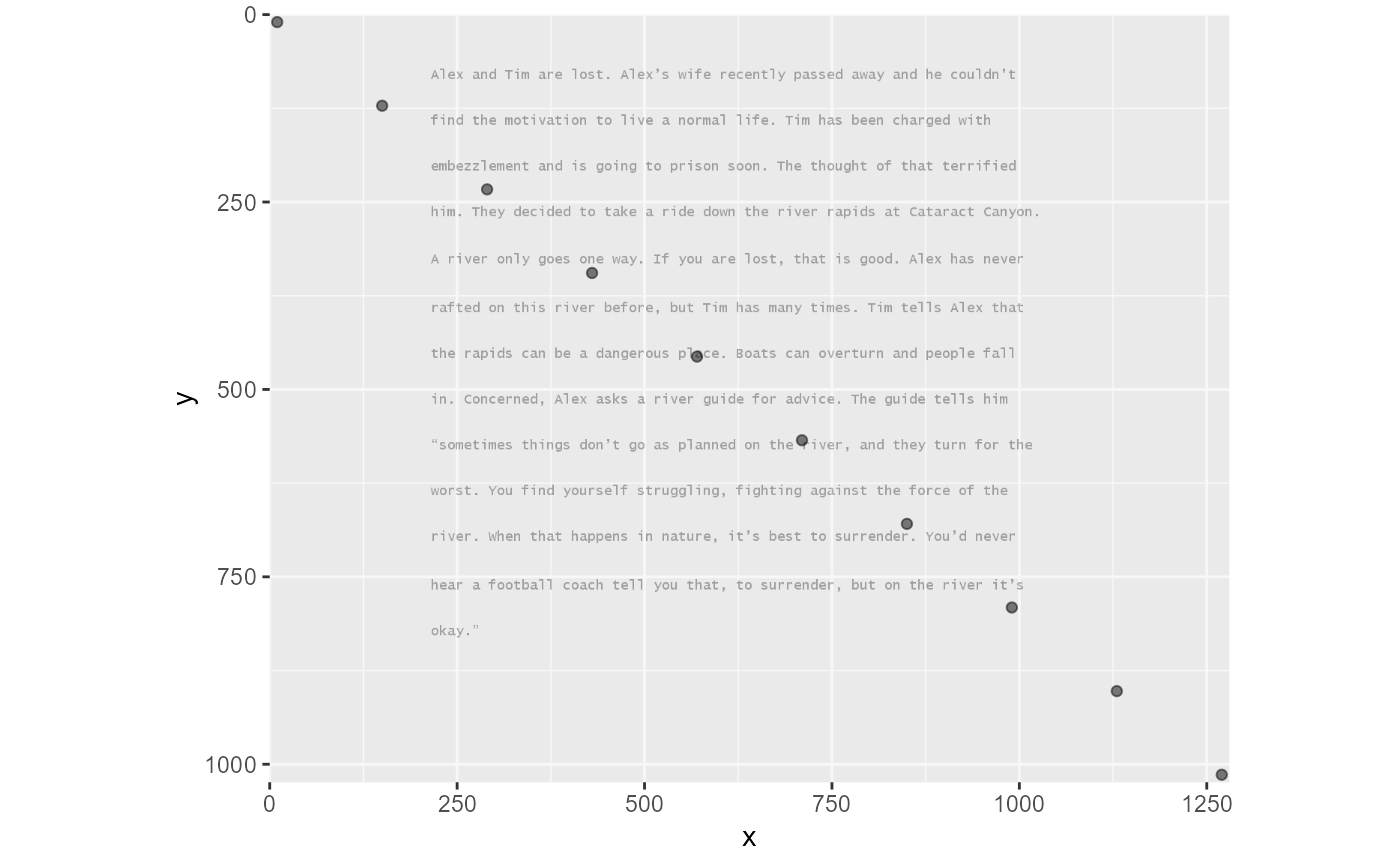
data <- data.frame(x=seq(10, 1270, length.out=10),
              y=seq(10, 1014, length.out=10))
bg <- system.file("extdata/story01.png", package="FDBeye")
fixPlot(data = data,
        bgImage = bg,
        xyMap = ggplot2::aes_string(x='x', y='y'),
        pointMap =ggplot2::aes_string())


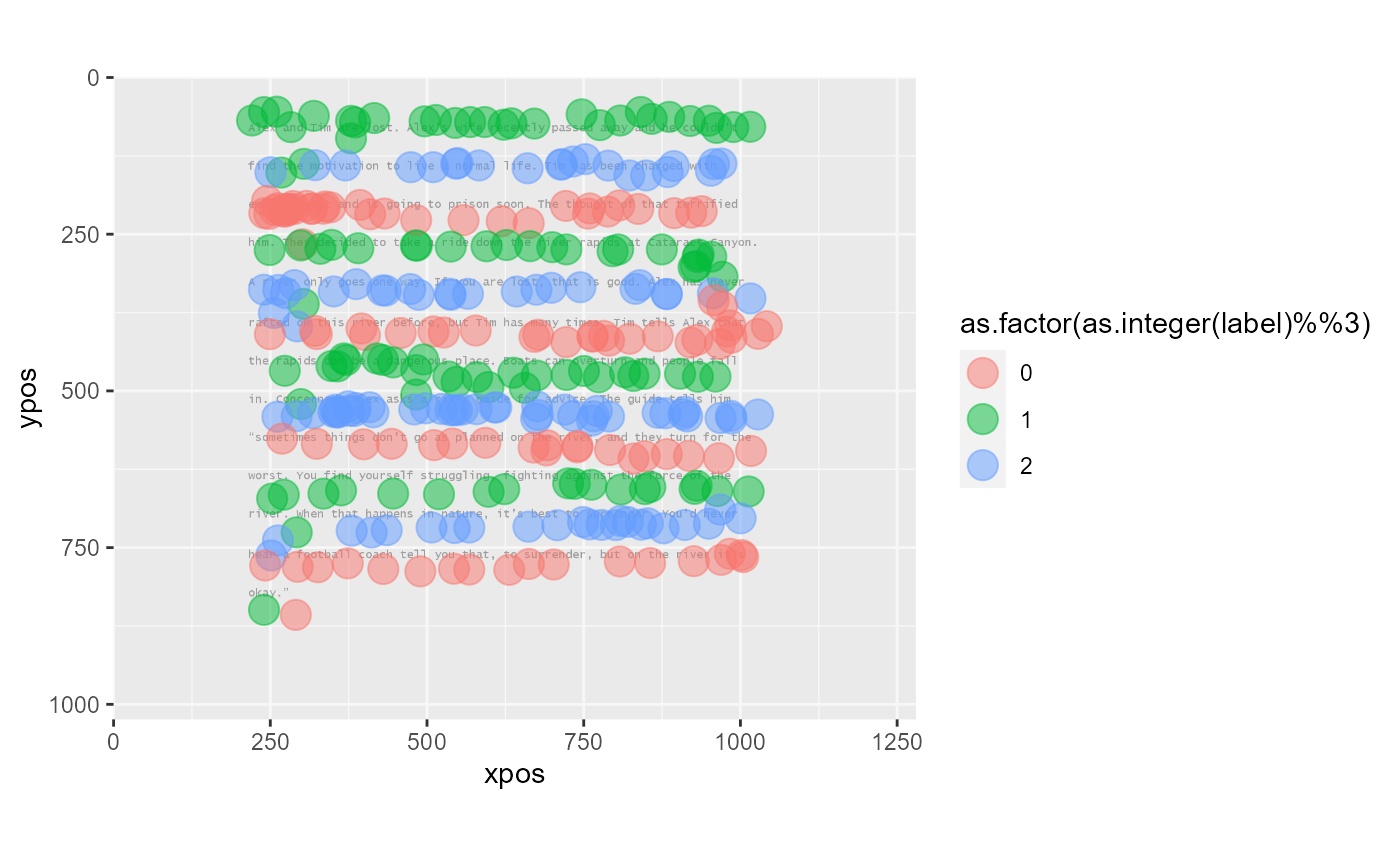
data(EToralreading)
D <- EToralreading
D$label <- as.factor(as.integer(D$label))

fixPlot(data=subset(D, subset=(subj=="s0149")&(story=="1")&(label %in% as.character(1:13))),
        bgImage=system.file("extdata/story01.png", package="FDBeye"),
        pointMap=ggplot2::aes_string(color="as.factor(as.integer(label)%%3)"), size=5,
                                     pointAlpha=.5)
